
API Market - Classic Value & Volume Paradox
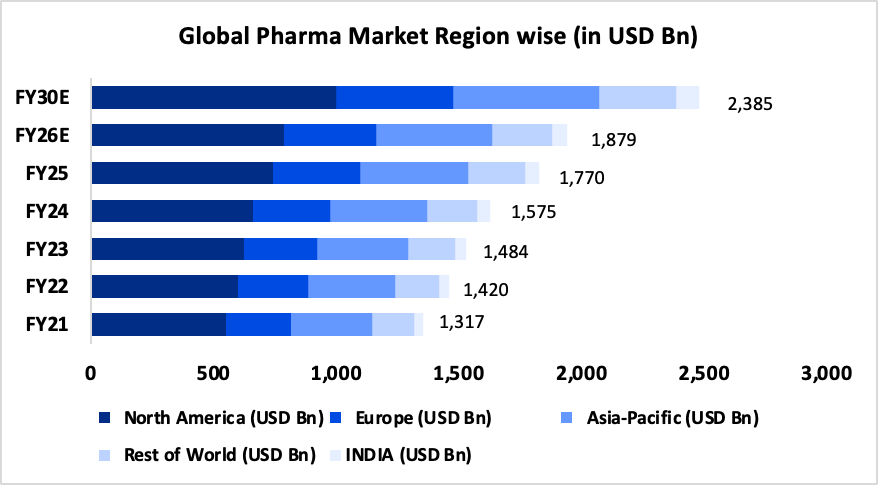
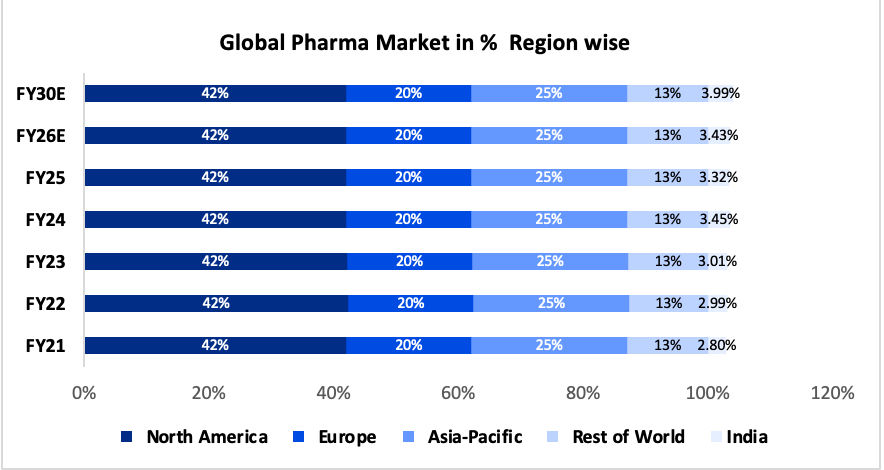
Global Pharmaceutical & API Market - Size & Growth
1.1 Market Context
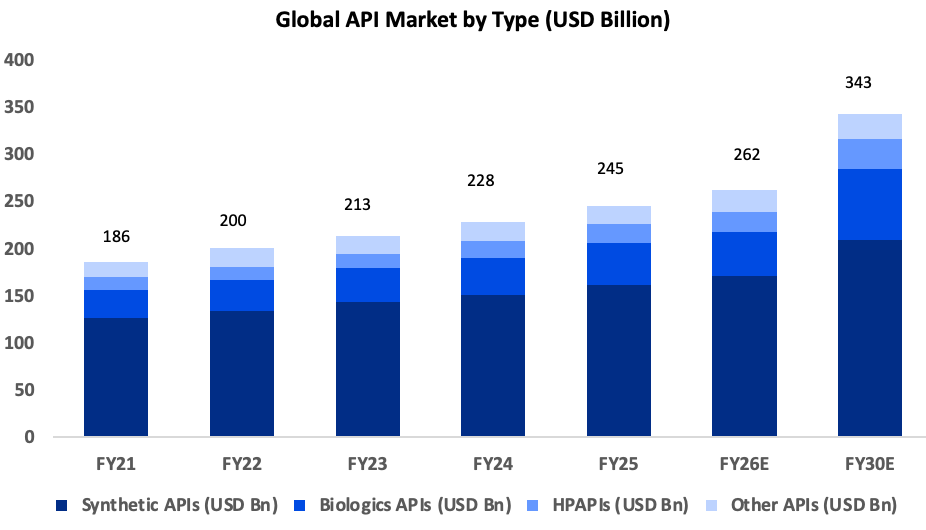
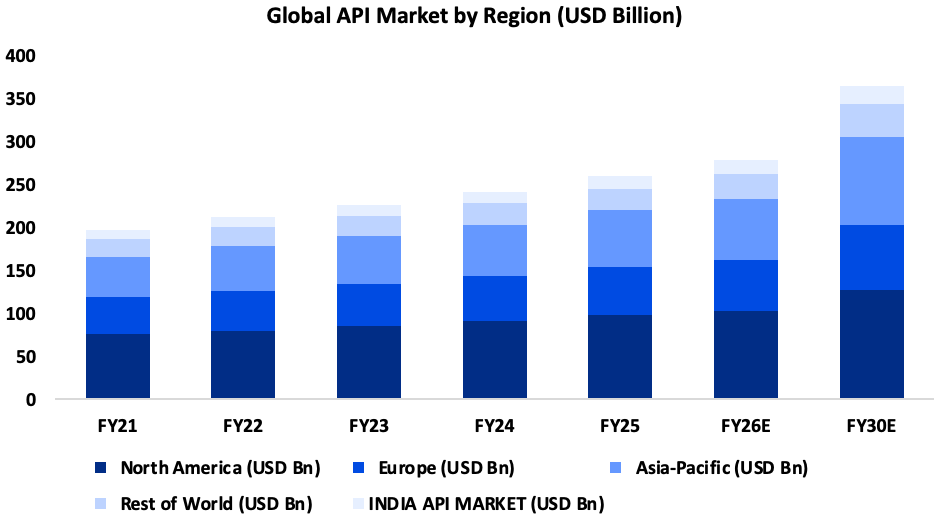
The global pharmaceutical market reached $1.77 trillion (~₹1,48,68,000 crore) in 2025, growing at a CAGR of 6.15% toward ~ $3.03 trillion (₹2,54,52,000 crore) by 2034. Within this, the API (Active Pharmaceutical Ingredients) market — the manufacturing of the chemical ingredients that make every drug therapeutically effective — sits at ~ $245–265 billion (approximately ₹20,58,000–22,26,000 crore) in 2025, representing roughly 12–14% of total pharma value.
1.2 Global Pharma & API Market - Historical & Forecast ($ Bn)
Global API Production by Country - Full Output (Captive + Domestic + Export)
The critical distinction in measuring API market size by country is that total production value includes three streams: captive APIs manufactured and consumed within the same pharmaceutical company (~50% of all API by value globally); domestic market sales to other manufacturers; and exports. When all three are included, the USA dominates by value while China dominates by volume, representing the central paradox of the global API industry.
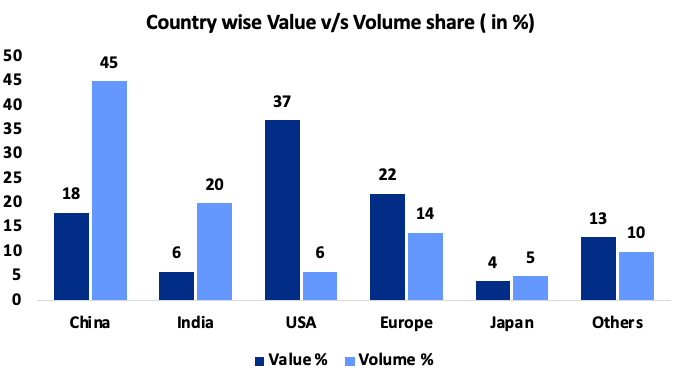
2.1 Country-wise API Production - Value vs Volume (2025)
2.2 The Value-Volume Paradox
The most important structural insight about the global API industry is the systematic gap between production volume and value capture. China produces approximately 45% of global API volume by physical weight (over 2 million tonnes per year), yet earns only 18% of global API value. India produces 20% of the volume and earns 6% of value. The USA produces 6% of volume and earns 37% of value.
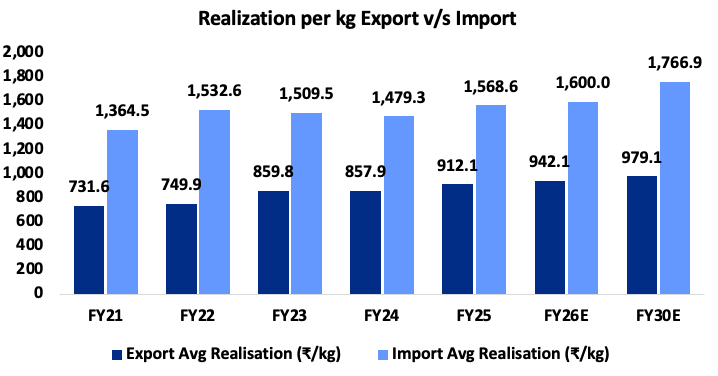
The explanation: the USA and Europe specialise in biologics (monoclonal antibodies worth $3,500–6,000 per gram), innovative oncology APIs, HPAPIs, and peptide intermediates. China and India dominate commodity generics — Penicillin-G at ₹21/kg, Paracetamol at ₹250/kg, Gabapentin at ₹400/kg. An enormous physical quantity, low rupee value per tonne. Closing this gap — moving from volume to value — is the defining strategic challenge for Indian API companies over the next decade.
India's API Industry - Total Production, Exports & Imports
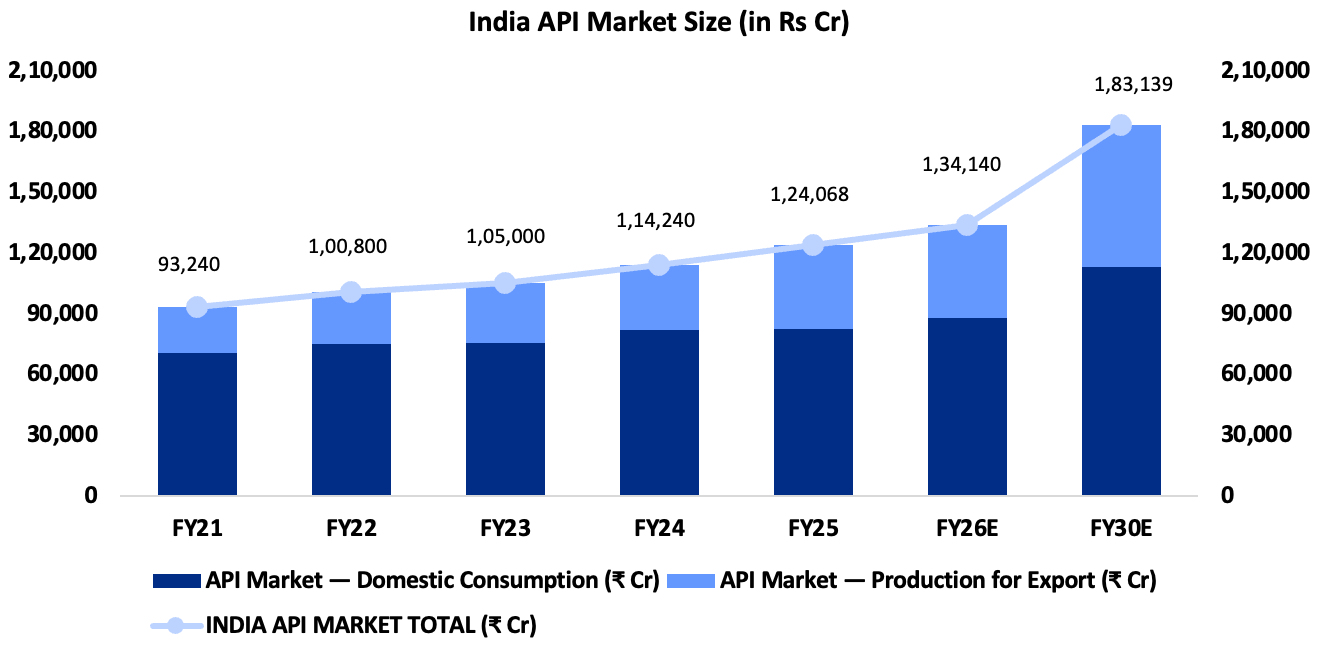
3.1 India API Market — Historical & Forecast
Sources: PharmaBiz March 2026
3.2 India API Export Volume (DGCIS Data)
DGCIS reports bulk-drug exports of 111–120 million kg per quarter in FY25, implying approximately 444–480 million kg annually. Of this, synthetic APIs represent approximately 80% (350–385 million kg) and fermentation-based APIs approximately 20% (90–100 million kg). Export volume is projected to grow from 455 million kg in FY25 to approximately 620 million kg by FY30 at a CAGR of 6–7%, driven by new molecule launches and CDMO programme ramp-ups.
3.3 India API Export Destinations — FY25
India's Dependency on China - The Molecule-by-Molecule Forensics
India's most significant structural vulnerability in the pharmaceutical supply chain is its near-total dependence on China for key starting materials (KSMs), intermediates, and APIs in critical therapeutic categories. Despite years of PLI investment and policy rhetoric about self-reliance, this dependence intensified rather than declined between FY20 and FY25.
4.1 China's Share of India's API Imports by Molecule (2024 Data)
Sources: RIS Working Paper (Prof Sudip Chaudhuri); ORF Expert Speak November 2025; DrugPatentWatch 2026 Report; PharmaBiz March 2026; BusinessToday July 2025. Data reflects 2024 import composition.
4.2 India's API Import from China — Value & Volume Trend (₹ Crore)
The critical insight: India's total API imports from China grew by 30% in volume between FY21 and FY24 (BusinessToday, July 2025), and China's share of India's imports rose from 68% to 74% over the same period — the opposite direction from the PLI scheme's stated objective. China strategically responded to India's PLI by cutting prices on non-PLI commodity APIs, making it economically irrational for Indian MSMEs to invest in domestic production of those molecules.
PLI Scheme - Detailed Analysis
5.1 Scheme Architecture
India's Production-Linked Incentive scheme for bulk drugs is the most significant pharmaceutical industrial policy in 30 years. It operates through two interlocking schemes with a combined outlay of ₹21,940 crore.
5.2 PLI Scheme Results as of March 2025
5.3 PLI Achievements — Notable Molecules Now Produced Domestically
The PLI scheme has enabled India to domestically manufacture several molecules for the first time in decades, including Penicillin-G (last made in India in the early 1990s), Clavulanic Acid, Atorvastatin, Metformin, Erythromycin, Rifampicin, and multiple vitamins. For several of these, import dependence has already been slashed by up to 50%.
5.4 PLI Limitations and the China Counter-Strategy
The PLI scheme's most important limitation is that it operates on a product-by-product incentive basis, while China's counter-strategy operates at the entire commodity API level. China did not compete on PLI-targeted molecules where Indian incentives are hard to beat. Instead, it slashed prices across the broader commodity API category — including Paracetamol (from ₹900/kg to ₹250/kg), Penicillin-G (50% price cut), and Clavulanate Potassium (40% cut) — making it economically impossible for Indian MSMEs to invest in those molecules even without the PLI umbrella. This has created a structurally two-speed Indian API market: PLI-supported molecules growing, non-PLI commodity molecules still dominated by Chinese pricing.
5.5 Bulk Drug Parks — The Infrastructure Complement
Three mega bulk drug parks in Andhra Pradesh (Vizag region), Gujarat, and Himachal Pradesh are under development with a combined government financial outlay of ₹3,000 crore. These parks address the structural cost disadvantage of Indian API manufacturing by providing shared infrastructure — solvent recovery units, effluent treatment plants, continuous power supply, and common utilities — that individual MSME-scale companies cannot economically build alone. India's energy cost and environmental compliance costs are significantly higher than China's. The parks are expected to reduce production costs by 15–20% for resident manufacturers once fully commissioned (expected 2026–2027). As of March 2025, an investment of ₹900 crore has been released to the state implementing agencies.
Regulatory Infrastructure - WHO-GMP & USFDA Certified Facilities by Country
India's most durable competitive advantage in the global API industry is not cost — it is regulatory depth. The number of USFDA-approved and WHO-GMP certified manufacturing facilities represents decades of quality investment that cannot be replicated quickly by any new geography.
Sources: LGM Pharma (USFDA site percentages, March 2025); India Govt (2,000+ WHO-GMP plants); DrugPatentWatch (China 3,539 DMFs). Note: USFDA site count ≠ active API suppliers. Some sites are registered but not actively supplying the US market.
Coming Opportunities for Indian API Companies
7.1 The Patent Cliff — $188 Billion in Brand Revenue at Risk (2022–2030)
The pharmaceutical patent expiry wave over 2025–2030 is the largest generics opportunity window in history. Blockbuster drugs, including Keytruda (Merck, patent 2028, ~$30B annual sales), Ozempic/semaglutide, Humira biosimilars, and dozens of oncology biologics will lose exclusivity. Each patent expiry creates fresh API demand, where India's regulatory track record and cost structure give it first-mover access. India already supplies 40% of US generic drugs and 25% of UK medicines.
7.2 The Biosecure Act Tailwind
The US Biosecure Act — which passed the House of Representatives in September 2024 with a 306-81 margin but stalled in the Senate — has already functioned as a durable supply chain signal even without formal enactment. Indian producers have seen a 50% spike in request-for-quotation volumes and facility audits from Western pharma companies since Q3 2024. The geopolitical direction of travel — reducing single-source Chinese dependency for critical medicines — is permanent regardless of whether any specific legislation passes.
7.3 India's Long-Term API Export Potential
India's API exports could potentially reach $12 billion (approximately ₹1,00,800 crore) by 2030 and $80–90 billion (approximately ₹6,72,000–7,56,000 crore) by 2047, according to PharmExcil projections, contingent on making adequate infrastructure investments and moving up the value chain from commodity generics into complex synthesis, CDMO, and biologics. The companies that invest now in backward integration, peptide platforms, contrast media, and CDMO capabilities will capture the decade's rewards.
7.4 The Structural Imperative: Value Over Volume
India's fundamental strategic challenge is captured in one number: it produces 20% of global generic API volume but captures only 6% of global API value. The path from 6% to 15% of global value does not run through making more Paracetamol and Penicillin — it runs through GLP-1 peptides, contrast media, ADC intermediates, HPAPIs, and complex custom synthesis for global innovators. The companies that understand this distinction and invest ahead of the demand curve will build Divi's-class competitive positions in their respective niches. The companies that remain in commodity fermentation-based generics will continue fighting a price war with a Chinese adversary whose cost floor they structurally cannot match.
Data Sources & Methodology
All financial figures in this report are sourced from the following primary and secondary research sources:
Global API market size: Precedence Research (Oct 2025), BusinessResearch Company (April 2026), Fortune Business Insights, IMARC Group, Towardshealthcare (Feb 2026), Mordor Intelligence (Jan 2026). Note: Market size varies $144–268B depending on whether captive APIs, biologics, and intermediates are included.
India API market: Mordor Intelligence ($14.77B in 2025, 8.31% CAGR), Actizaindustry.com (DGCIS quarterly export data), DrugPatentWatch (Dec 2024, India importance analysis).
India exports/imports: PharmaBiz (March 2026 — FY25 exports ₹41,500 Cr, imports ₹39,214 Cr); BusinessToday (July 2025 — Lok Sabha reply); PHARMEXCIL (destination analysis).
China dependency: ORF Expert Speak (November 2025); RIS Working Paper Prof Sudip Chaudhuri; DrugPatentWatch 2026 China Generic API Report; LGM Pharma (March 2025).
PLI Scheme results: Department of Pharmaceuticals (DoP) Lok Sabha reply July 2025; DrugPatentWatch (Dec 2024); BusinessToday (investment figures as of March 2025).
WHO/USFDA facilities: LGM Pharma (USFDA 22% USA, 21% India, 20% China — February 2025 data); Government of India (2,000+ WHO-GMP plants); Mordor Intelligence India API report (Jan 2026).
China/India export comparison: DCAT/CPA analysis; BioSpace/Statista 2023 volume data.
Future opportunities: Vantage Market Research (Sept 2025); Evaluate Pharma 2025 World Preview; PharmExcil 2047 projections.
Disclaimer: This document is compiled for research and analytical purposes. All figures represent the best available data as of May 2026. Market size figures from different research firms vary due to different definitions of API market boundaries. INR equivalents computed at ₹84 per USD. Not for investment decisions without independent verification.
0
37
2
Author
Diksha Kalra
Publish Date
08 Jun 2026
Reading Time
15 mins
Share On
Table Of Content
Global Pharmaceutical & API Market - Size & Growth
Global API Production by Country - Full Output (Captive + Domestic + Export)
India's API Industry - Total Production, Exports & Imports
India's Dependency on China - The Molecule-by-Molecule Forensics
Data Sources & Methodology
Tags
Office Address: MiQB, Plot 23, Sector 18, Maruti Industrial Development Area, Gurugram, Haryana 122015
Registered Office Address: 1001, Block G1B, Pocket-1, Phase-2, Samriddhi Apartments, Dwarka Sector-18B, New Delhi-110078
Email: help@alphaamc.com • Phone: +91-93-1137-8001
Alpha Ventures Private Limited
(Formerly known as Planify WealthX Pvt Ltd)
Sponsor Name
Planify Venture LLP
Investment Manager
Fund Managers
VentureX Fund I (SME)
Other Websites
Disclaimer
You acknowledge and confirm that by accessing the website, you are seeking information relating to the organisation of your own accord and that there has been no form of solicitation, advertisement or inducement by the organisation. Any part of the content is not, and should not be construed as, an offer or solicitation to buy or sell any securities or make any investments or any products. No material/information provided on this website should be construed as investment advice. Any action on your part on the basis of the said content is at your own risk and responsibility.
Financial Documents
Policies
© 2026 Alpha AMC. All rights reserved, Built with ❤️ in India